Gold Price Forecast: Battle lines well-defined amid thin market conditions – Confluence Detector
- Gold price rebounds as the US dollar dips amid risk recovery.
- Treasury yields stabilize, Omicron covid variant fears continue to loom.
- Defending 100-DMA is critical for gold bulls amid Omicron woes, thin trading.
Gold price is rebound in tandem with the risk-on trading, as the market sentiment recovery on Tuesday, knocking down the safe-haven US dollar. Meanwhile, the US Treasury yields stabilize at higher levels, aiding gold’s upside. However, investors remain wary and refrain from placing aggressive bets amid looming concerns over the Omicron covid variant contagion and its impact on the global economic recovery. Looking ahead, gold price will remain at the mercy of the broader market sentiment.
Read: Gold 2022 Outlook: Correlation with US T-bond yields to drive yellow metal
Gold Price: Key levels to watch
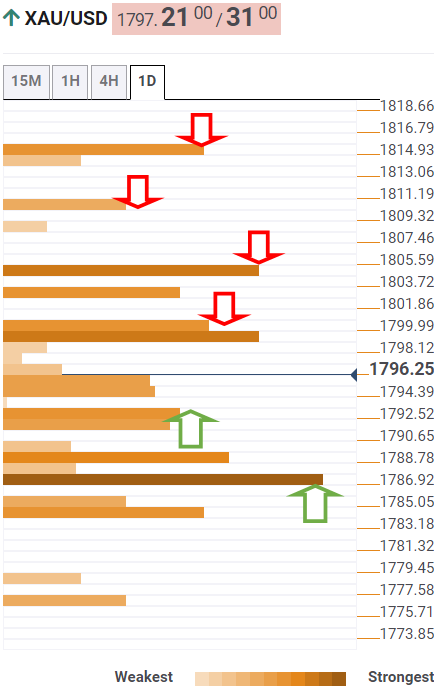
The Technical Confluences Detector shows that the gold price is likely to challenge strong resistance around $1,800 on its road to recovery. That level is the convergence of the Fibonacci 61.8% one-day, Fibonacci 23.6% one-week and SMA50 one-day.
If the latter is taken out convincingly, then gold bulls will look to retest the previous day’s high at $1,804.
Fresh buying opportunities will emerge on a break above the previous day’s high, exposing the pivot point one-day R2 at $1,810.
The previous week’s high of $1,814 will be the level to beat for gold buyers.
Alternatively, strong support awaits at the Fibonacci 23.6% one-day at $1,792, below which the confluence of the SMA100 one-day and the previous day’s low at $1,788 will be put to test.
Sellers will then target a $1,786 demand area, where the SMA5 one-day, SMA50 four-hour and SMA200 one-hour coincide.
Here is how it looks on the tool
About Technical Confluences Detector
The TCD (Technical Confluences Detector) is a tool to locate and point out those price levels where there is a congestion of indicators, moving averages, Fibonacci levels, Pivot Points, etc. If you are a short-term trader, you will find entry points for counter-trend strategies and hunt a few points at a time. If you are a medium-to-long-term trader, this tool will allow you to know in advance the price levels where a medium-to-long-term trend may stop and rest, where to unwind positions, or where to increase your position size.