AUD/USD Price Analysis: Pokes weekly support with eyes on 0.7080 retest
- AUD/USD remains pressured around intraday low, drops the most among G10 currency pairs.
- Bearish MACD signals, failures stay past 100/200 HMAs keep sellers hopeful.
- 61.8% Fibonacci retracement level lures sellers, fortnight-long horizontal area adds to the upside filters.
AUD/USD breaks the weekly support line, down 0.45% intraday, while flashing 0.7125 as a quote heading into Wednesday’s European session. The Aussie pair’s losses are the heaviest among the Group of Ten (G10) currency pairs.
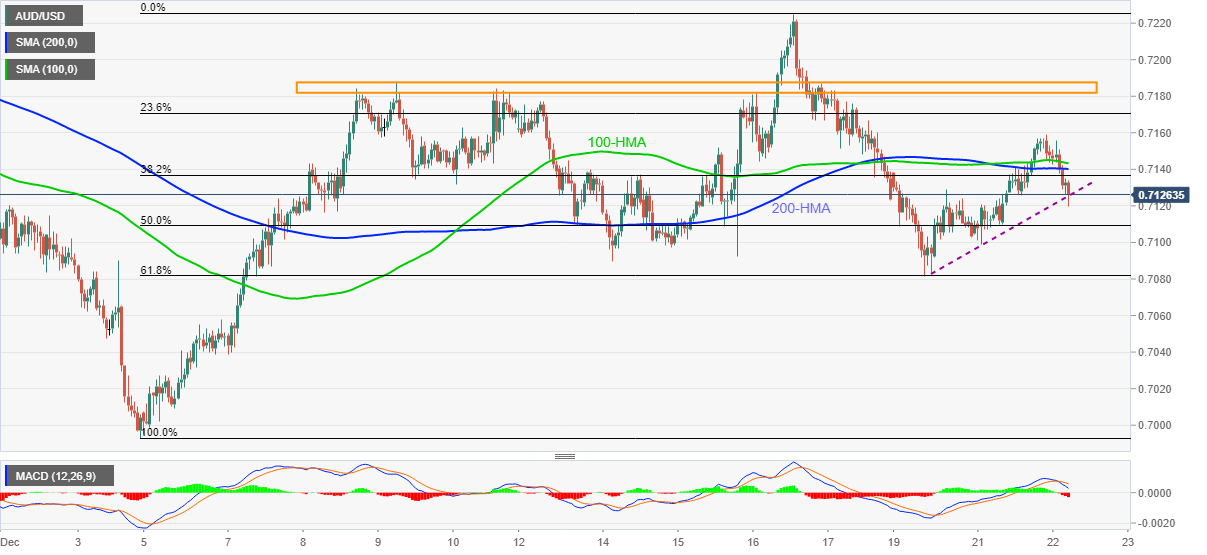
Despite bouncing off 61.8% Fibonacci retracement (Fibo.) of December 03-16 upside, near 0.7080, AUD/USD failed to stay beyond convergence of the 100-HMA and 200-HMA close to 0.7140-45.
That said, the latest pullback moves may initially test the 50.0% Fibo. level of 0.7109 and then the 0.7100 threshold before revisiting the aforementioned key Fibonacci retracement support around 0.7080.
In a case where AUD/USD drops below 0.7080, the 0.7050 and 0.7030 levels may offer intermediate halts before dragging the quote back to the 0.7000 psychological magnet and the yearly low of 0.6993.
Meanwhile, a clear run-up beyond 0.7145 will aim for a two-week-old horizontal resistance zone surrounding 0.7180-90.
Should the quote rises past 0.7190, the monthly top close to 0.7225 will return to the chart.
AUD/USD: Hourly chart
Trend: Further weakness expected