USD/TRY Price Analysis: Sellers on the lookout for $13.00 break to retake control
- USD/TRY remains pressured after reversing from two-week top.
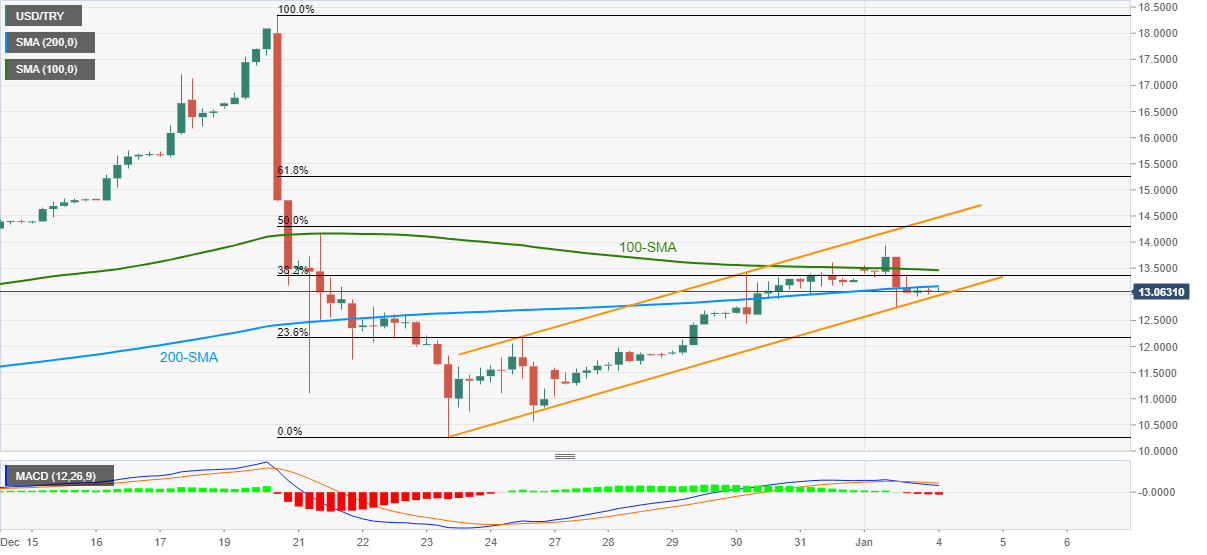
- Downside break of key SMAs, bearish MACD signals keep sellers hopeful inside short-term ascending trend channel.
- Recovery moves need validation from $14.50, bears can aim December’s low.
USD/TRY carries the previous day’s pullback from a fortnight high of around $13.00, down 0.24% intraday, during Tuesday’s Asian session.
The USD/TRY pair’s heaviest daily loss since December 23, portrayed on Monday, pulled the quote back below the 100-SMA and 200-SMA amid bearish MACD signals.
However, a two-week-long ascending trend channel defends USD/TRY bulls around $13.00.
Hence, sellers need to wait for the $13.00 breakdown for fresh entries before targeting the 23.6% Fibonacci retracement (Fibo.) level of the December 20-23 downturn, near $12.15.
In a case where USD/TRY bears keep reins past $12.15, the last month’s low near $10.25 and the $10.00 psychological magnet should return to the charts.
Alternatively, 100-SMA and 200-SMA guard the immediate upside of the pair, respectively around $13.15 and $13.45.
Adding to the resistance is the 50% Fibo. of $14.30 and the upper line of the stated channel, near $14.50.
USD/TRY: Four-hour chart
Trend: Further weakness expected