USD/JPY Price Analysis: Bids building above 115.50's puts 116.00 and then 117.00 on the radar
- Bulls engage for prospects to 116 the figure and 117 thereafter.
- Bullish tendencies are present across the time frames.
USD/JPY has been building a bullish case since the end of January. For the first trading days of the week, we have seen a series of semi bullish closes following a sharp correction of the start of February's rally: USD/JPY Price Analysis: Bulls are engaging and eye a break of 115 the figure. The demand that is building above 115.50 gives rise to the prospects of a bullish continuation as follows:
USD/JPY daily chart
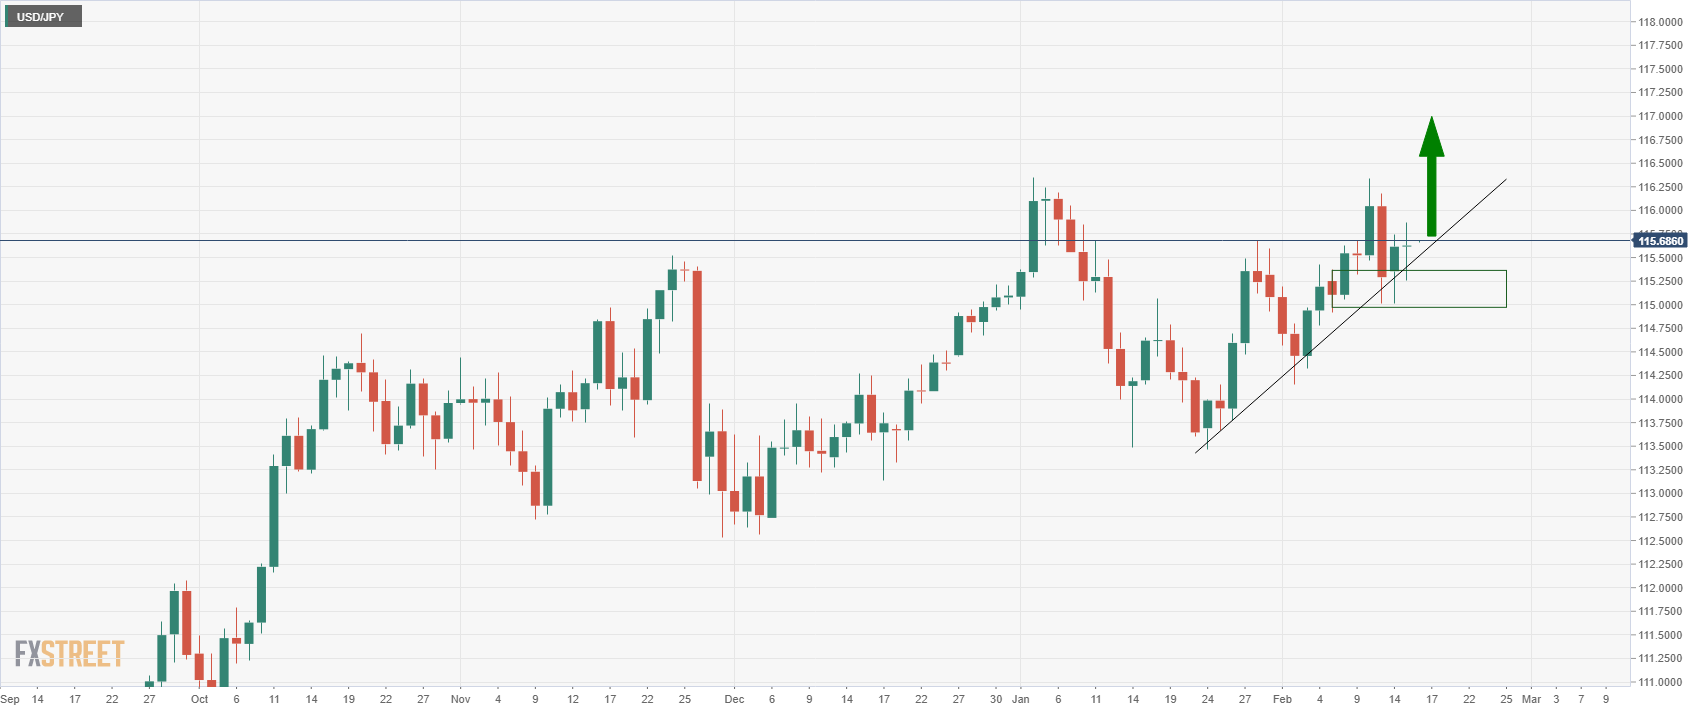
The daily chart shows that the price has pulled back into an area of the structure that would be expected to support and encourage buyers at a discount to the daily highs. 117.00 is on the radar.
USD/JPY H4 chart
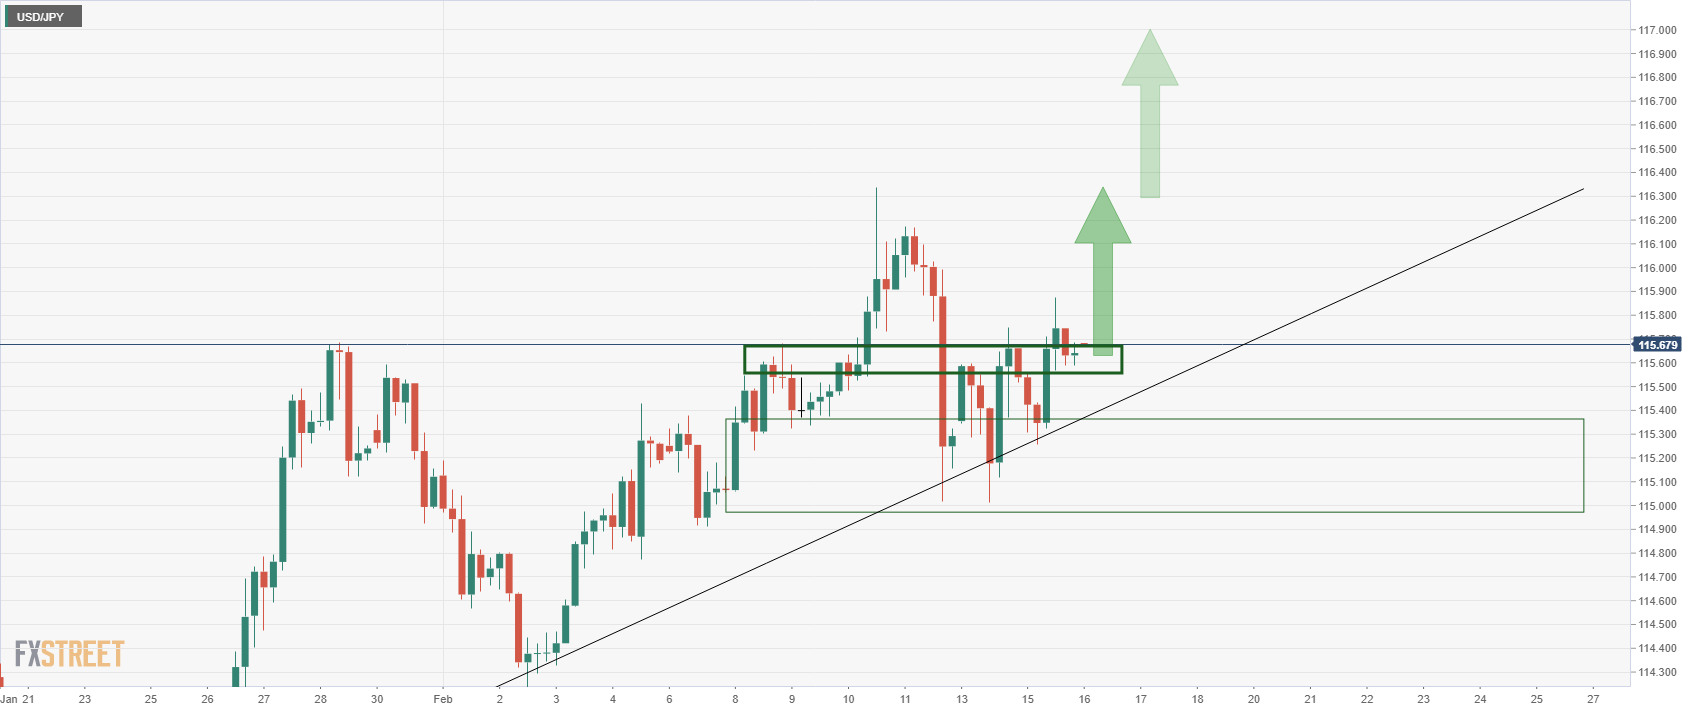
The four-hour chart offers a close up of the same scenario.
USD/JPY H1 chart
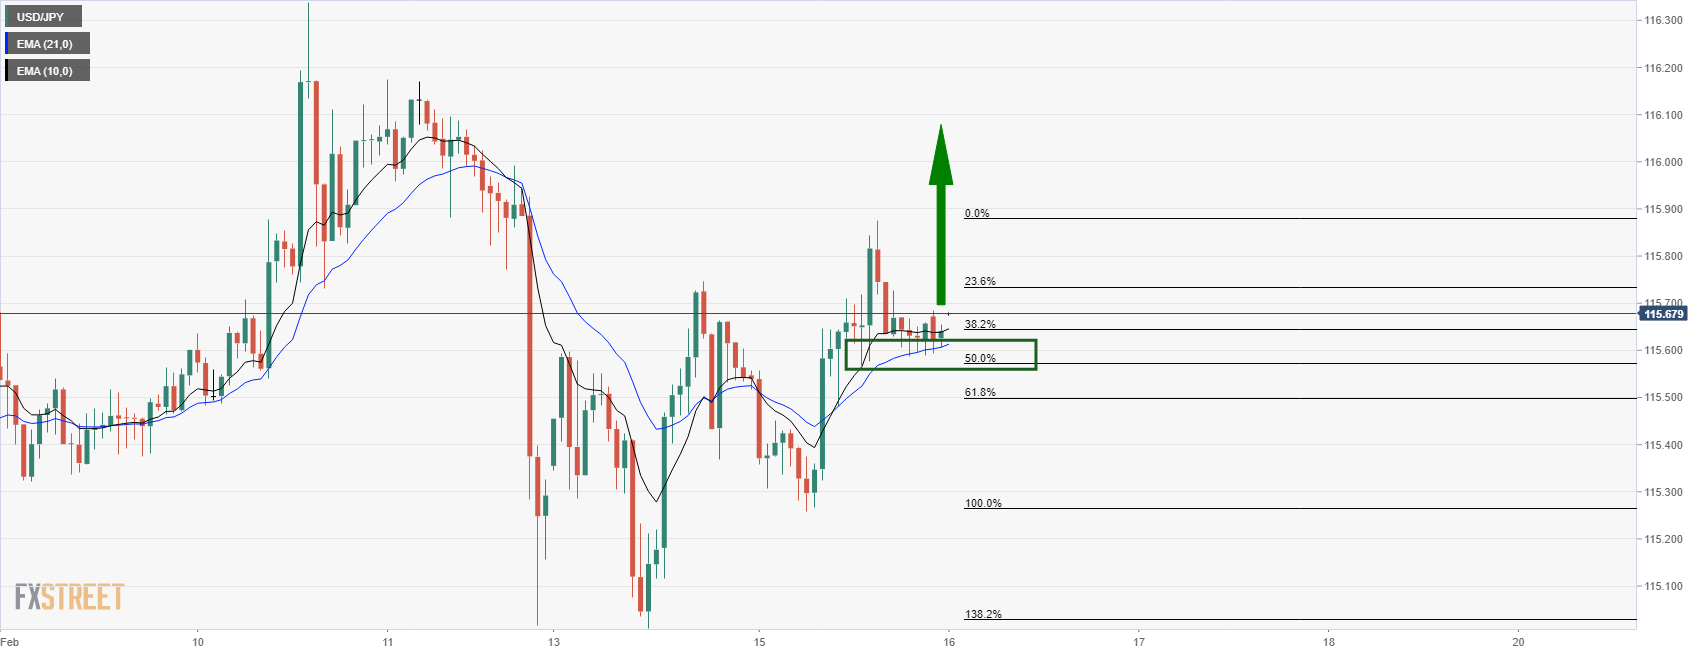
The hourly chart zooms in on a fractal basis and shows a bullish relationship between the 21 and 10 EMAs.
USD/JPY M15 chart
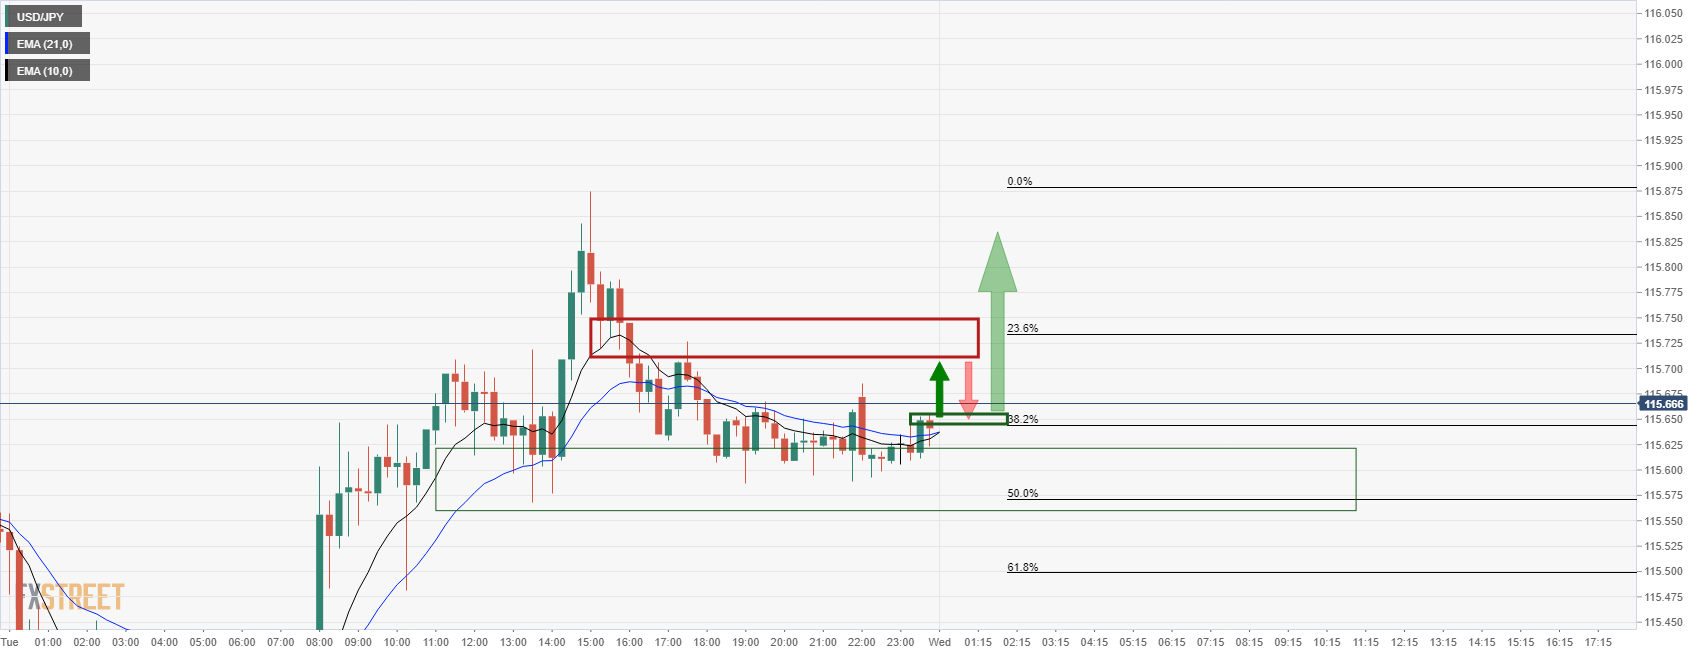
The 15-min chart is a mirror image and the above scenario forecasts where support of the EMAs meeting prior highs could act as a support should the price break higher. This is where further buying activity could result in a fresh bullish impulse to target towards 116 the figure for the coming sessions.