US Dollar Index Price Analysis: DXY renews weekly top with eyes on 96.50
- DXY stays above 50-DMA for almost a week, prints two-day uptrend at the latest.
- Firmer MACD, RSI also direct bulls towards mid-February high.
- Rising wedge offers food for thought but four-month-old support line acts as a tough nut to crack for bears.
US Dollar Index (DXY) stays mildly bid around an eight-day high despite recently easing to 96.30 during Thursday’s Asian session.
In doing so, the greenback gauge rises for the second consecutive day, also portraying the fifth daily move beyond the 50-DMA.
Also favoring the DXY buyers are the bullish MACD signals and firmer RSI, not overbought.
That said, the mid-February high near 96.43 will act as an immediate hurdle for the quote ahead of the 23.6% Fibonacci retracement (Fibo.) of October-January upside, near 96.47.
Following that, the resistance line of a three-week-old rising wedge, near 96.62, can test the US Dollar Index upside ahead of the tops marked in late 2021 around 96.90-97.00.
On the flip side, pullback moves may initially aim for the 50-DMA level surrounding 96.00 and support line of the stated wedge, near 95.90.
Even if the rising wedge confirmation pleases DXY bears, the 100-DMA and an upward sloping support line from October 2021, respectively around 95.50 and 95.40, will challenge the downside.
DXY: Daily chart
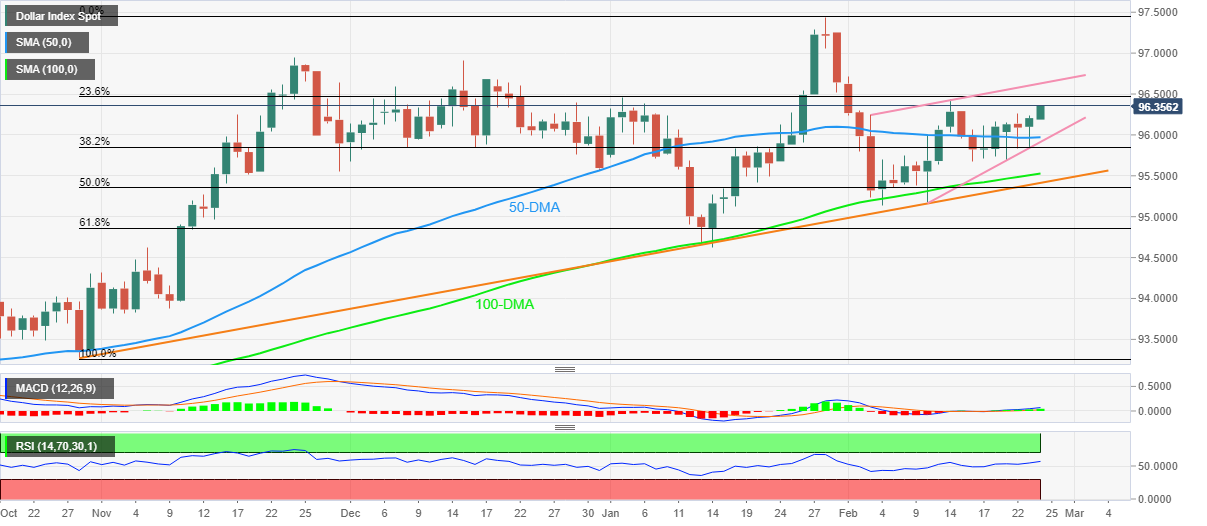
Trend: Further upside expected