4 Jul 2022
GBP/JPY Price Analysis: Bulls and bears battle it out for territory
- GBP/JPY is at a crossroads and the downside is compelling as per the hourly timeframe.
- On a medium-term outlook, the bulls could take up the bias.
GBP/JPY is a compelling feature on the currency charts due to the two-way business opportunities it presents across the daily and hourly time frames.
The following illustrates the M and W formations that would be expected to play out in the coming sessions.
GBP/JPY daily chart
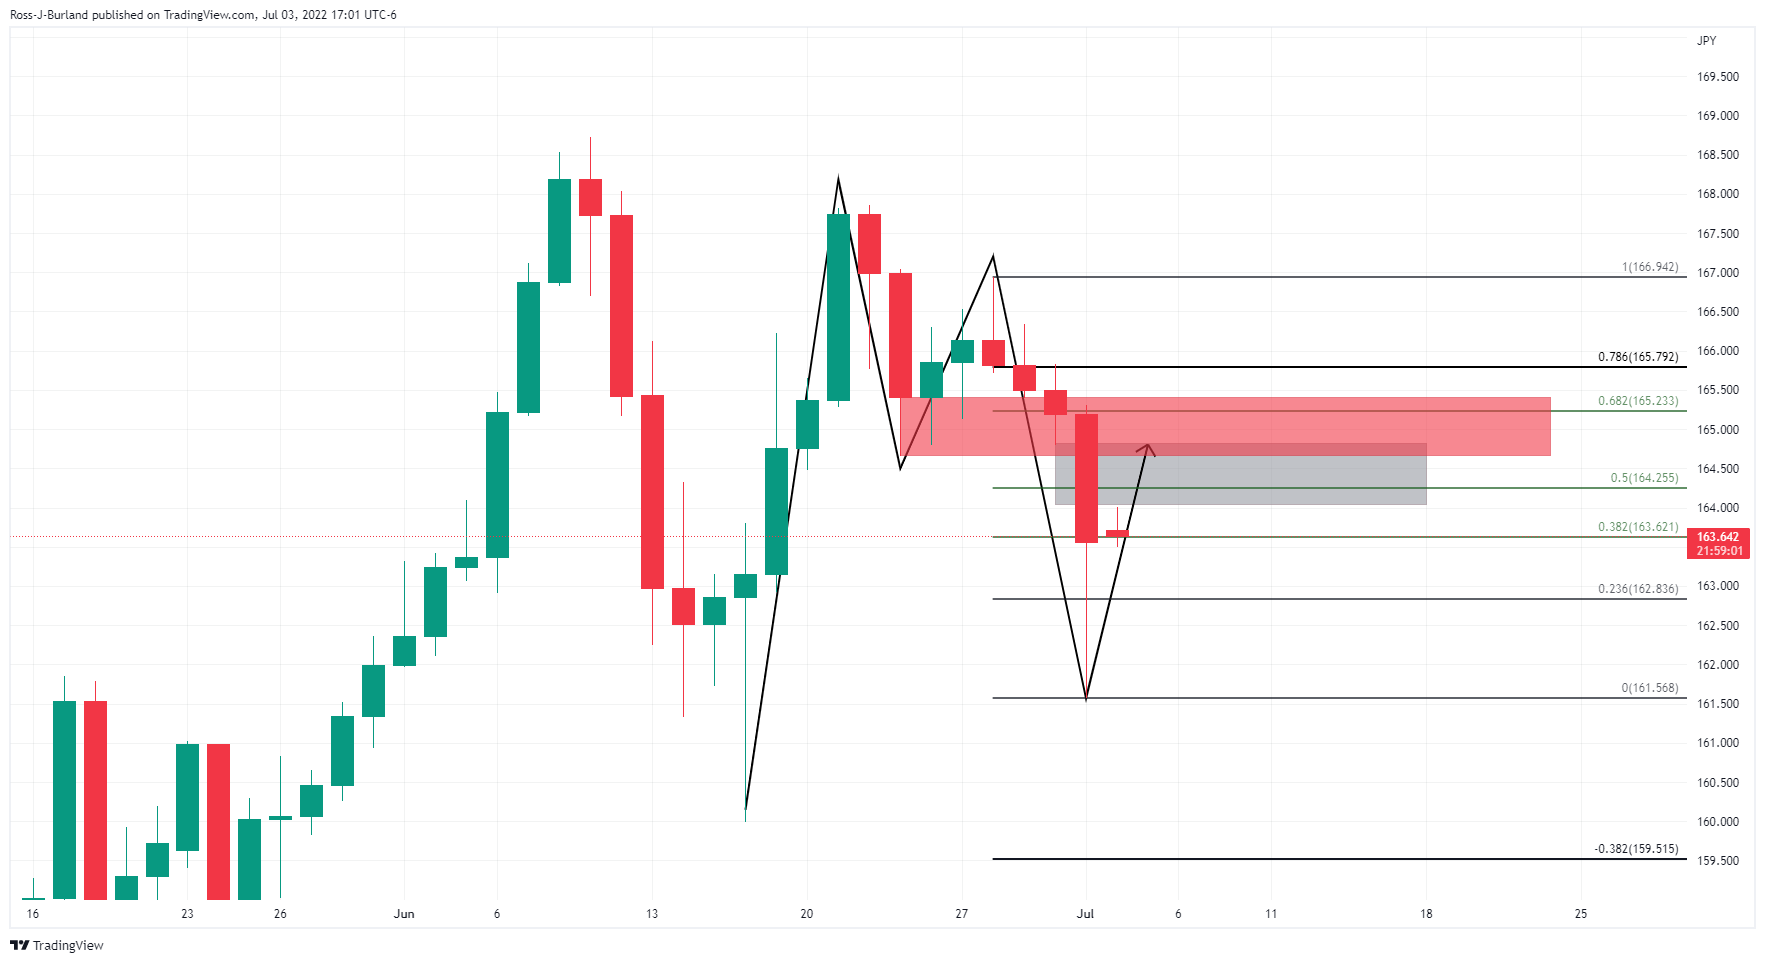
The M-formation is a bullish reversion pattern and the price is anticipated to revisit the neckline of the pattern in due course. This currently has a confluence with the price imbalance and a 61.8% ratio thereafter.
GBP/JPY hourly chart
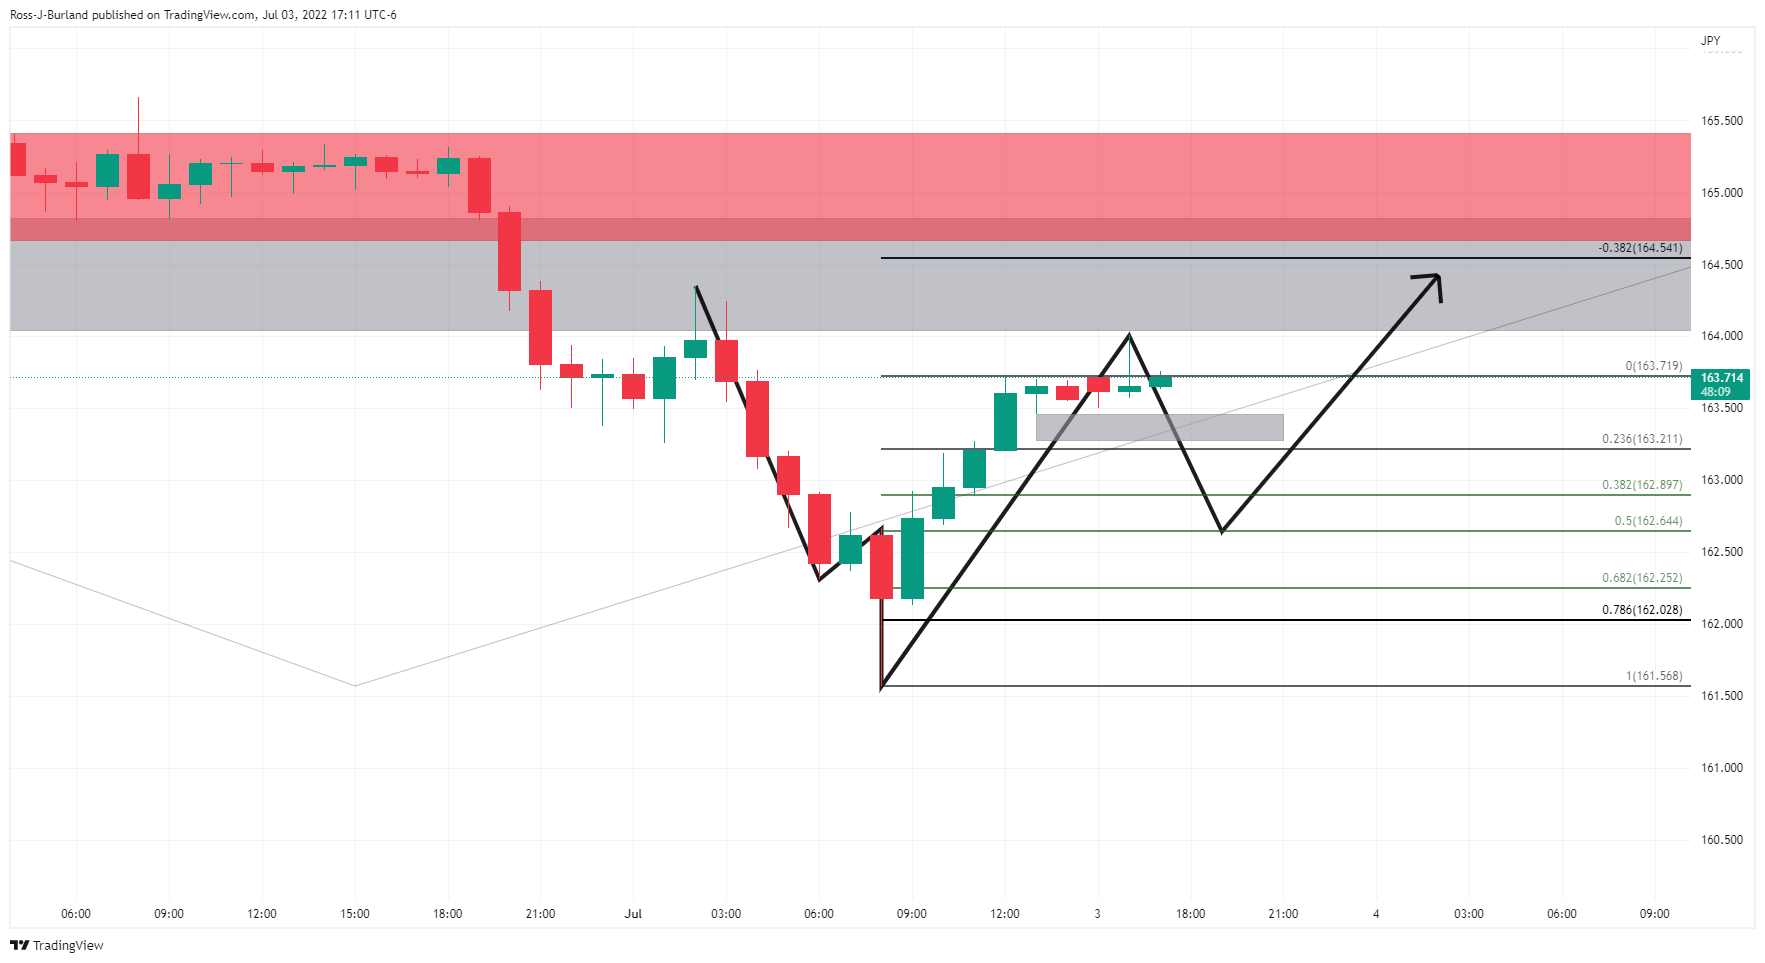
The hourly W-formation, however, would be expected to draw in the price for the meantime as illustrated above. A 50% mean reversion aligns with the neckline of the pattern currently.