WTI Price Analysis: Bears battle with 200-DMA at five-month low around $93.50
- WTI holds lower ground at intraday low, nearly the lowest levels since late February.
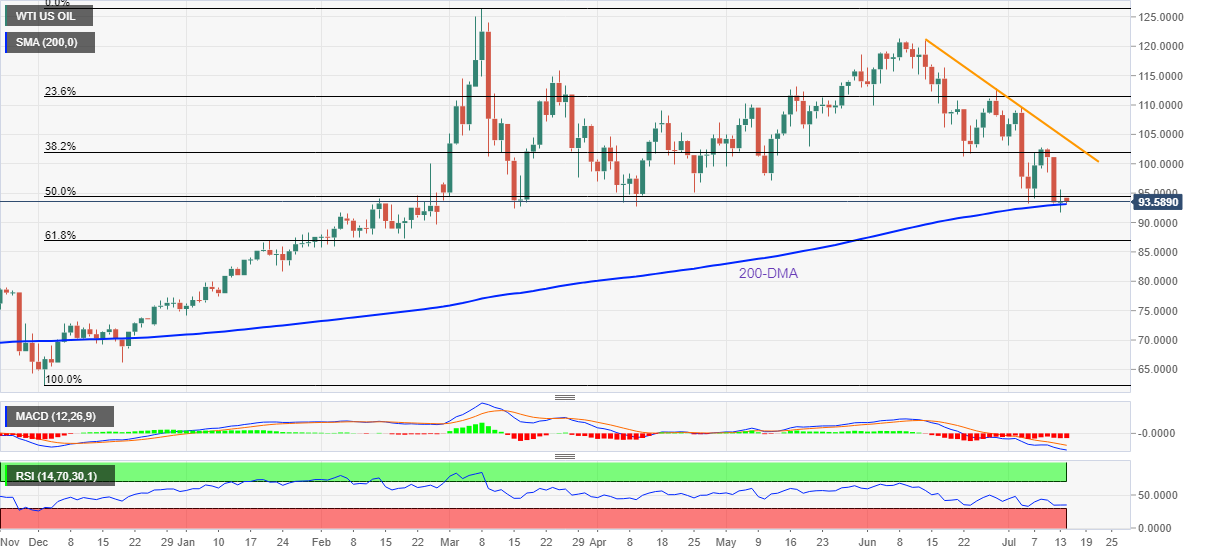
- Bearish MACD, downbeat RSI favor joins clear break of 50% Fibonacci retracement level to favor sellers.
- Monthly resistance line holds the key to buyer’s entry.
WTI crude oil prices fade the previous day’s rebound from the 200-DMA as sellers attack $93.50 during Thursday’s Asian session.
In doing so, the black gold portrays sustained trading below the 50% Fibonacci retracement of December 2021 to March 2022 upside while poking the key moving average support.
It’s worth noting that the bearish MACD and an absence of the oversold RSI also keep sellers hopeful to break the $93.13 DMA support.
Following that, the $90.00 psychological magnet will precede the 61.8% Fibonacci retracement level of $86.85 to lure the WTI bears.
Alternatively, recovery moves need to cross the 50% Fibonacci retracement level of $94.42 to tease buyers.
Even so, the $100.00 threshold and last Friday’s peak near $102.80 could test the energy bulls before directing them to the monthly resistance line surrounding $104.20.
Overall, WTI remains on the bear's radar even if the 200-DMA challenges the immediate downside of the commodity prices.
WTI: Daily chart
Trend: Further weakness expected