19 Jul 2022
GBP/USD Price Analysis: Bears are moving in to test around 1.1950 with eyes lower
- GBP/USD is being pressured back to test 1.1950.
- The bears have moved in and a run towards trendline support could be on the cards.
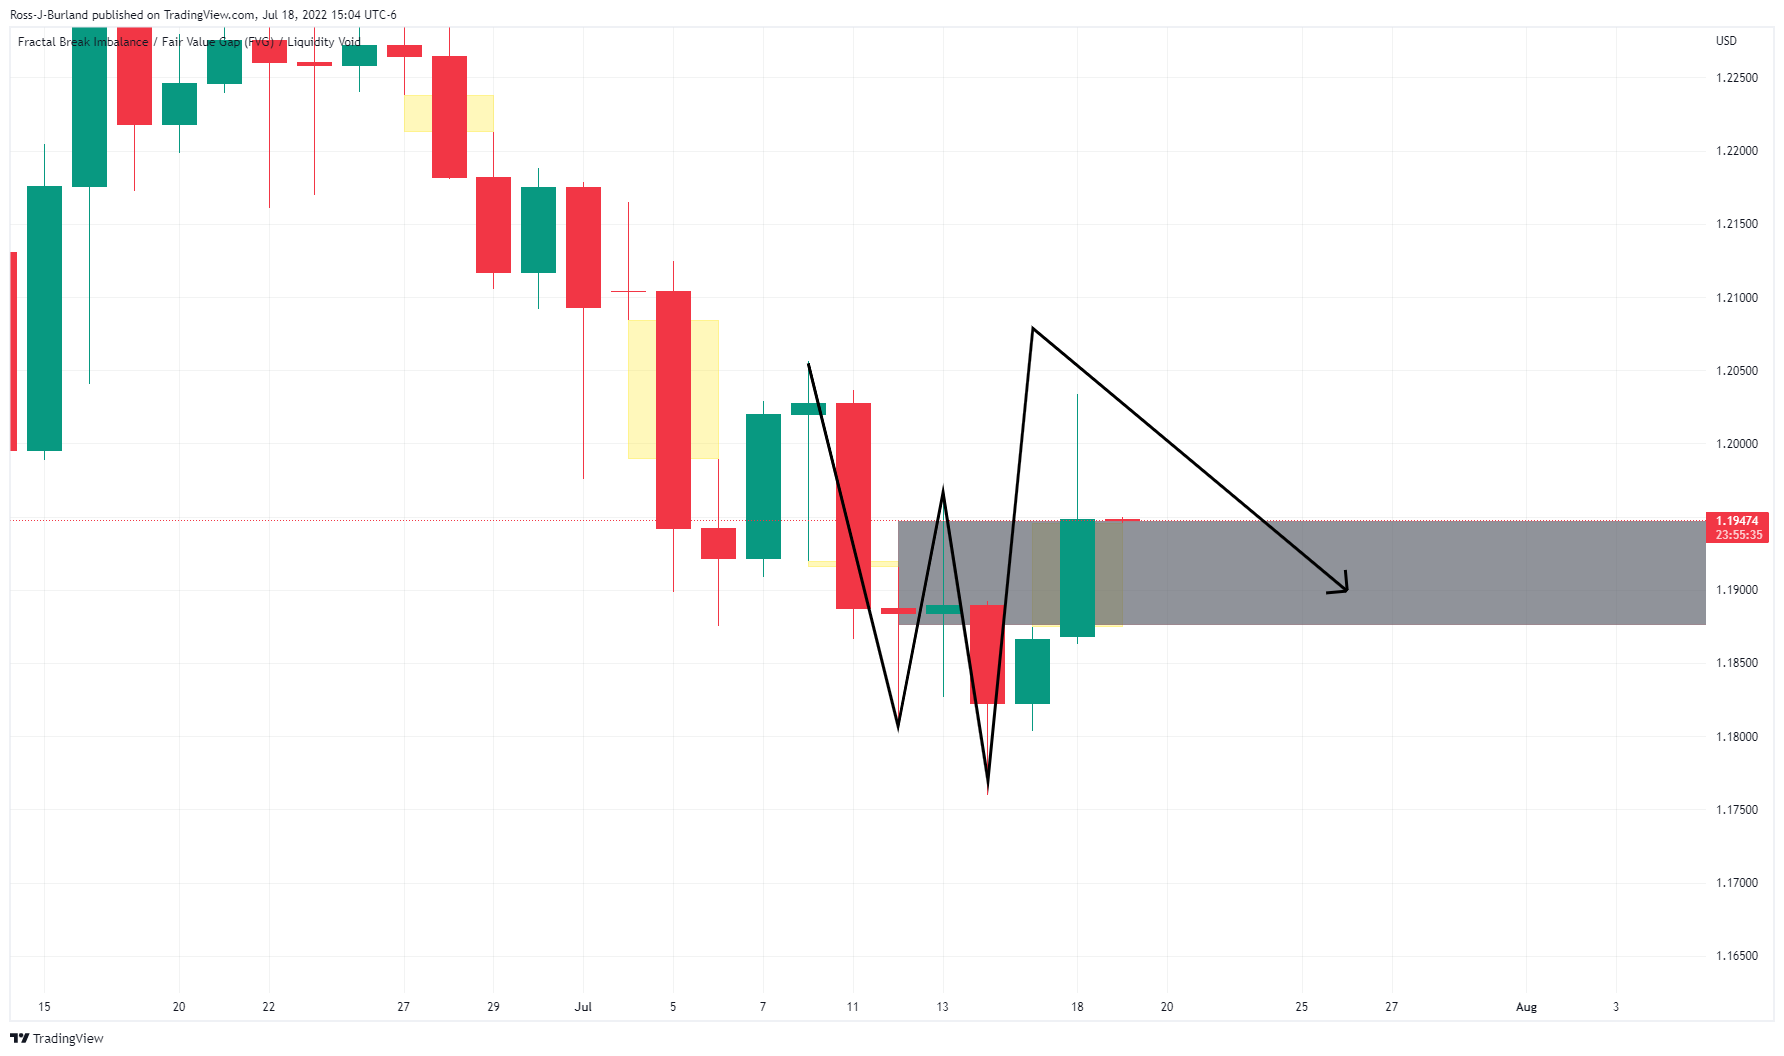
The daily chart's W-formation has seen the price hamstrung towards the neckline area where there is a price imbalance that could be mitigated in the coming sessions to test below 1.19 the figure again.
GBP/USD daily chart
GBP/USD M15 chart
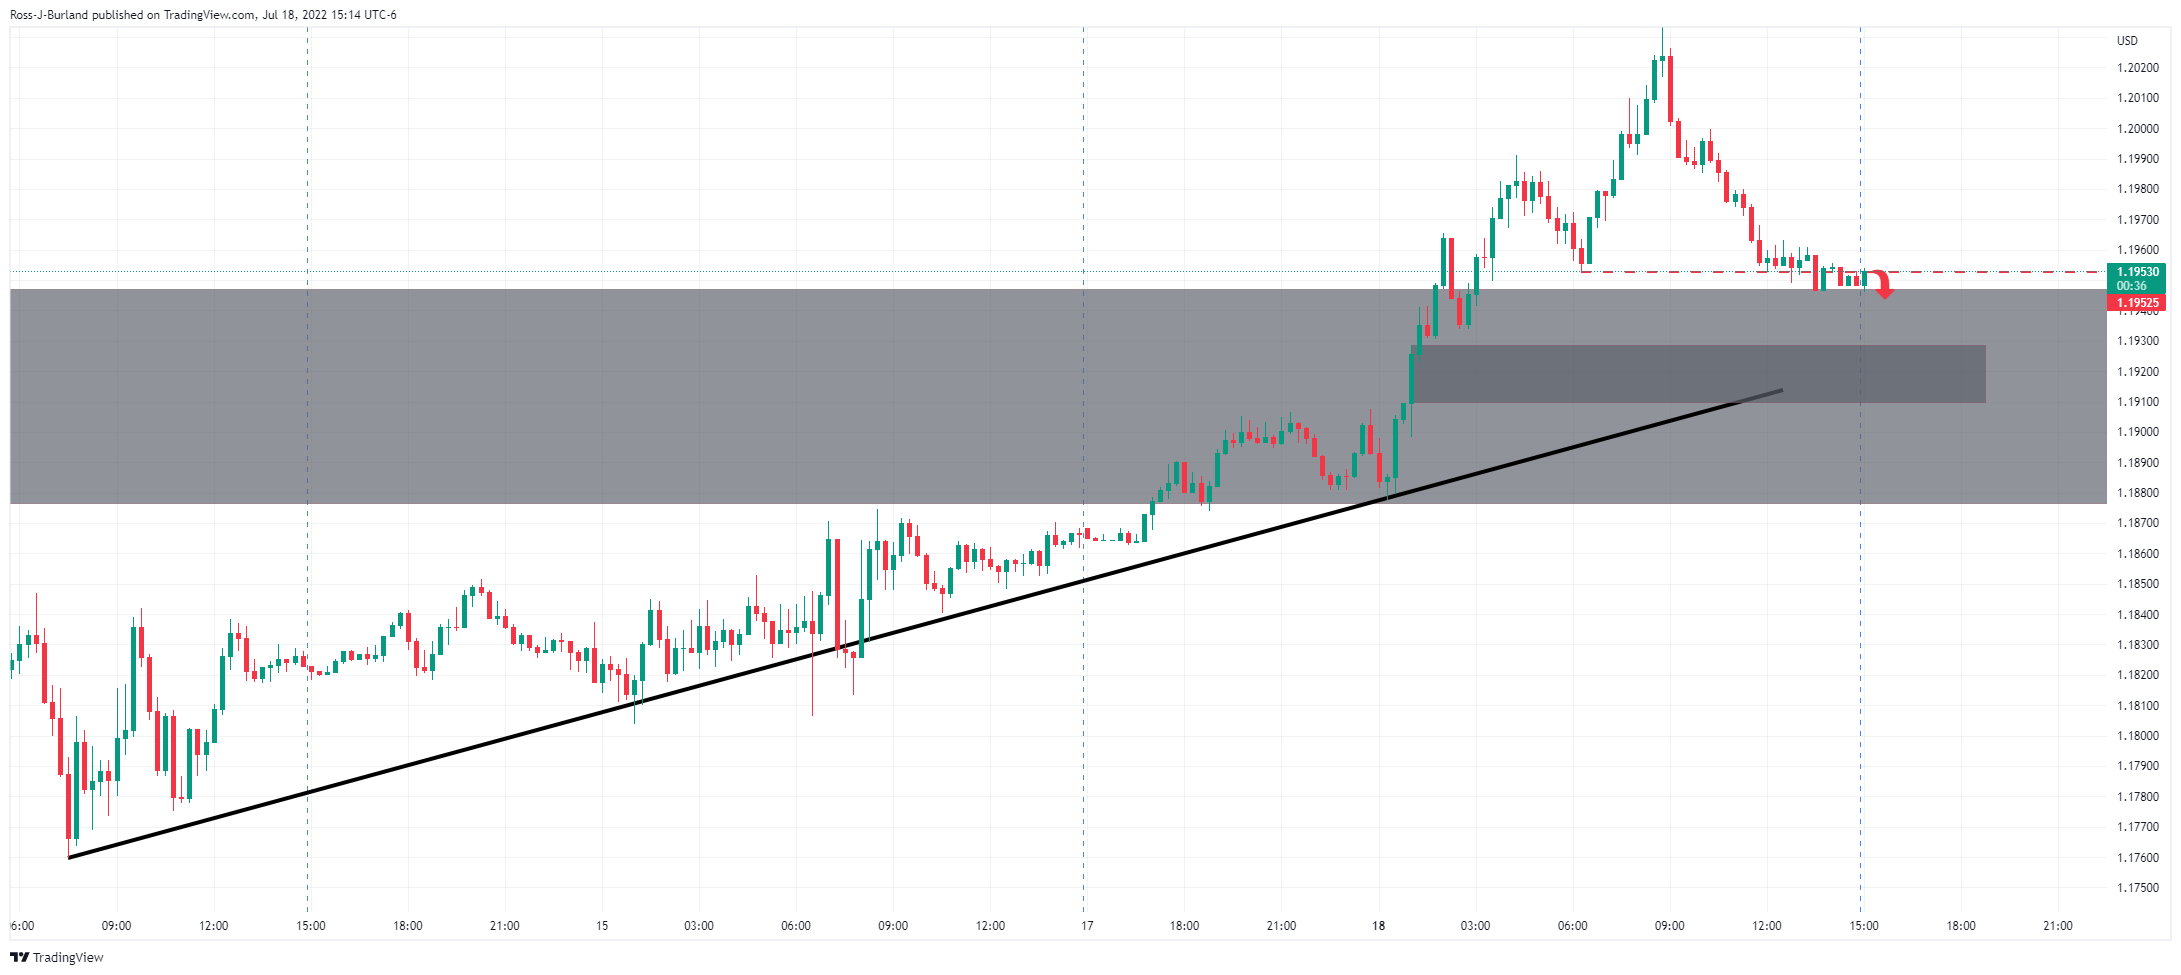
The 15-min chart is accumulated around 1.1950 which could see a breakout to the downside and towards 1.1900 in the day ahead in order to take out the price imbalance within the 1.1880 rally. This will bring the price towards a test the trendline support for the coming days.