GBP/USD Price Analysis: Rising wedge probes buyers around 1.2050
- GBP/USD retreats from intraday high, stays mildly bid around monthly peak.
- 200-SMA, six-week-old resistance line guards immediate upside.
- Bears need validation from 1.1980 to retake control.
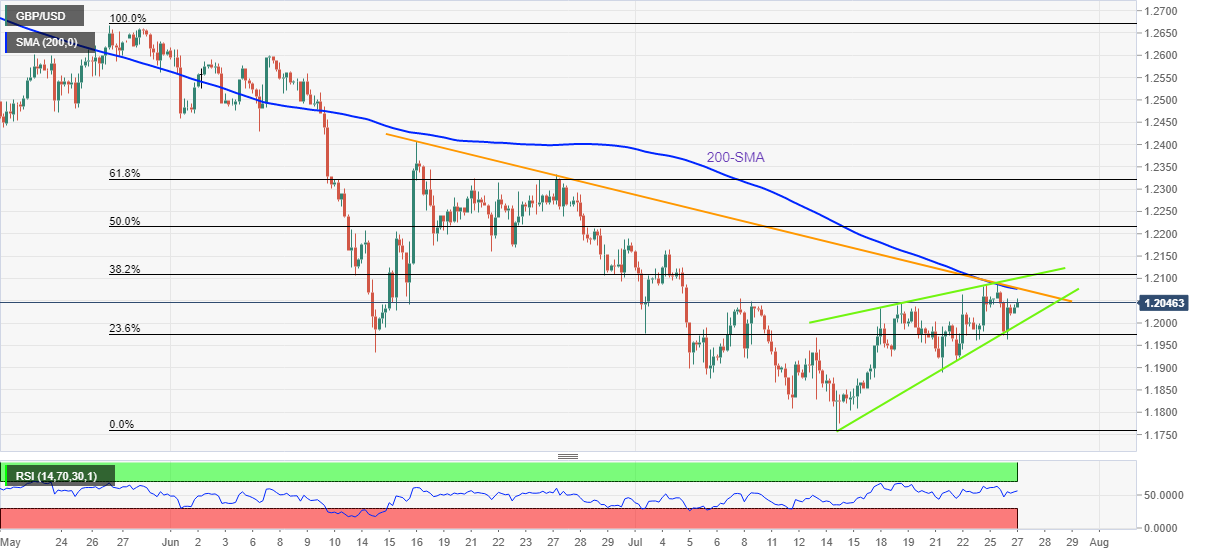
GBP/USD bulls take a breather around 1.2050 inside a fortnight-old rising bearish chart pattern during early Wednesday. That said, recently firmer RSI backs the Cable pair’s corrective pullback from the yearly low.
However, a convergence of the 200-SMA and a downward sloping resistance line from mid-June, around 1.2080, guards the quote’s immediate upside.
Even if the GBP/USD buyers manage to cross the 1.2080 hurdle, the upper line of the stated wedge, near 1.2100, will be crucial for the pair traders.
In a case where the prices remain firmer past 1.2100, the odds of witnessing a run-up towards the monthly high near 1.2165 can’t be ruled out.
Alternatively, pullback moves become interesting on breaking the support line of the bearish chart formation, around 1.1995 by the press time.
Even so, multiple levels marked around 1.1980 during the last fortnight appears as the additional downside filter before welcoming the GBP/USD bears.
To sum up, GBP/USD buyers should remain cautious unless witnessing a successful break of 1.2100.
GBP/USD: Four-hour chart
Trend: Pullback expected