WTI Price Analysis: Bulls approach $88.00 on falling wedge confirmation
- WTI grinds higher around intraday top, keeps the previous day’s bounce off six-month low.
- Confirmation bullish chart pattern joins bullish MACD signals to keep oil buyers hopeful.
- 200-HMA, a fortnight-old resistance line can test the upside momentum.
- Sellers have a bumpy road to the south to witness.
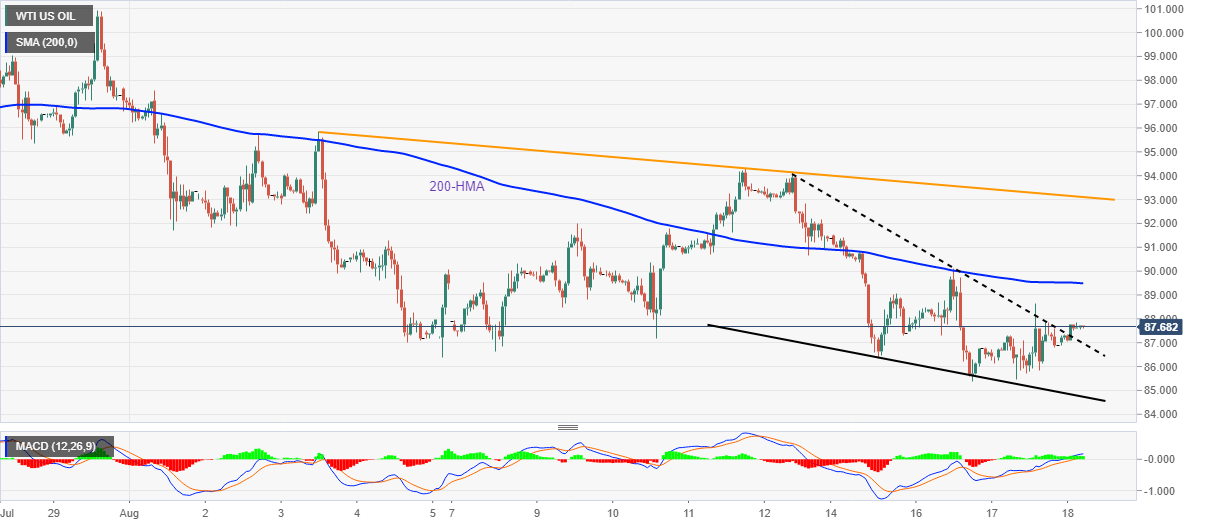
WTI crude oil remains firmer around $87.65, up nearly 1.0% heading into Thursday’s European session, as the black gold buyers cheer the confirmation of the bullish chart pattern.
In addition to the falling wedge breakout, bullish MACD signals also keep the WTI buyers hopeful of poking the 200-HMA hurdle of $89.50.
During the quote’s run-up beyond $89.50, the $90.00 threshold and a downward sloping resistance line from August 03, near $93.10, will be on the buyer’s radar.
It’s worth mentioning that the quote’s successful upside past $93.10 needs validation from the previous Thursday’s peak near $94.35 to convince the bulls.
Meanwhile, pullback moves remain elusive until staying beyond the weekly falling wedge’s upper line, at $87.00 by the press time.
Even if the energy benchmark drop below $87.00, the recent multi-month low of $85.39 and the lower line of the wedge, close to $84.80 at the latest, could also challenge the bears.
Above all, the WTI bears should wait for a clear downside break of the October 2021 peak surrounding $84.90 to tighten the grip.
WTI: Hourly chart
Trend: Further upside expected