WTI Price Analysis: Bulls eye $100.00 on breaking 50/200 DMAs
- WTI bulls take a breather around monthly top after running the most in six weeks.
- Bullish MACD signals, clear break of the key DMAs favor buyers.
- Previous resistance line adds to the downside filters.
- 38.2% Fibonacci retracement level, late July peak lure buyers.
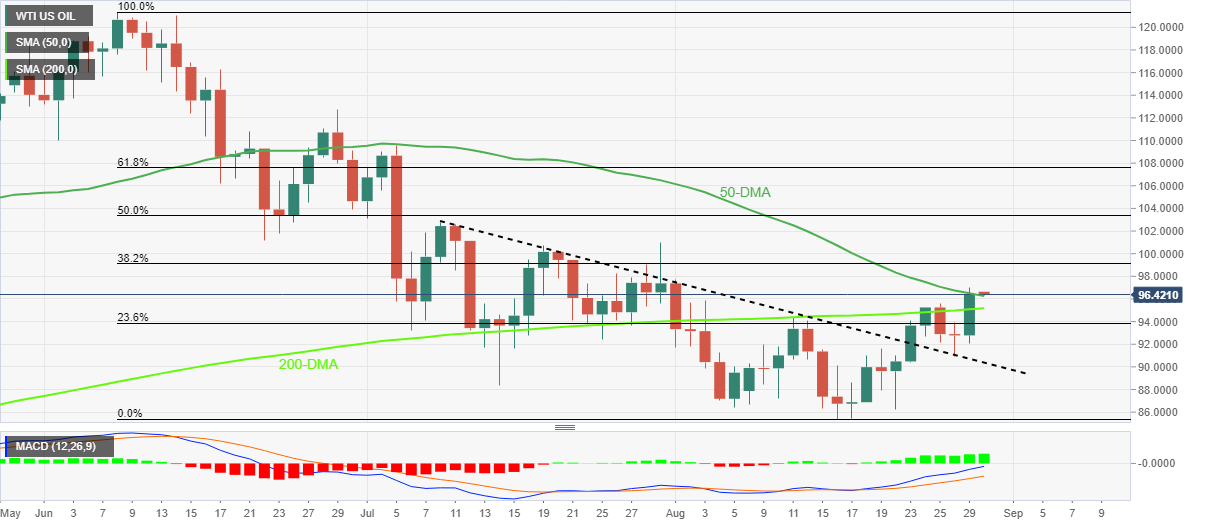
WTI crude oil prices remain sidelined around $96.50, after rising the most in 1.5 months the previous day. In doing so, the black gold seesaws around the monthly high while keeping the previous day’s upside break of the 50-DMA and the 200-DMA.
The upside bias also takes clues from the bullish MACD signals and the quote’s ability to rebound from the resistance-turned-support line from early July on Friday.
That said, the 38.2% Fibonacci retracement of the energy benchmark’s downtrend from June, near the $99.10, seems to lure the intraday buyers ahead of the $100.00 threshold.
However, late July’s swing high around $101.00 and the 50% Fibonacci retracement level of $103.35 could challenge the WTI buyers afterward.
On the contrary, the 50-DMA support of $96.20 could challenge the immediate pullback moves ahead of the 200-DMA, close to $95.15 at the latest.
Following that, the previous resistance line from July 08, near $90.30 at the latest, will be important to watch for WTI bear’s entry.
WTI: Daily chart
Trend: Further upside expected